Quadrupolar Order in UPd3
(First Year Transfer Report)

M. D. Le
Supervisor: K. A. McEwen
Department of Physics and Astronomy
University College, London

Jan 18, 2007

Abstract

We describe a crystal field scheme and mean-field calculation that explains the observed bulk and microscopic properties of UPd3. We also report a magnetostriction experiment in applied magnetic field up to 33T, and the observation of a phase transition when the field is parallel to the a-direction at 27.8±0.5T and at 26.8±0.5T when the field is parallel to the b-direction. No phase transition at high fields was observed when the field was parallel to the c-direction.

Contents

1  Introduction
2  Crystal Field Interactions
    2.1  Inelastic Neutron Data
    2.2  Crystal Field Parameter Fitting
3  Mean Field Calculations
4  High Field Magnetostriction
    4.1  Experimental Methods
    4.2  Experimental Results
    4.3  Meanfield Calculations
5  Conclusions
A  fitengy.m

1  Introduction

In addition to the work on UPd3 detailed in this report, I have also worked on several other systems during my studies to this point. These included experiments on the (U,Th)Ru2Si2 system where we measured the quasi-elastic peaks in samples with 80%, 60%, 20% and 10% Uranium in order to support the hypothesis that the hidden order transition in URu2Si2 may be described by an Anisotropic Kondo Model; on UCuP2, a Uranium ferromagnet where we measured the high temperature crystal field excitations; and on Lu2V2O7, a ferromagnetic semiconductor where we measured the high energy excitations, looking for the semiconductor band-gap and the crystal field transitions. The above experiments were all conducted on the High Energy Transfer (HET) chopper spectrometer at the ISIS facility. We also have an on going project to study the ordered phase excitations in PrB6, which shows antiferromagnetic ordering with an incommensurate wave vector below 7K, and again with a commensurate wavevector below 4.2K. Extensive measurements of the excitations in the commensurate phase were taken on the V2 triple-axis spectrometer at the Berlin Neutron Scattering Centre (BENSC), and further measurements in the incommensurate phase and in an applied magnetic field are planned. Finally, I have also been involved with experiments at the Institute for Transuranium Elements (ITU) on PuPd3, measuring the photo-electron spectra, magnetisation and specific heat. However, this report will focus on UPd3, the system that I have spent the most time studying over the past year.
Uranium palladium-3 is a well studied uranium intermetallic compound which exhibits four phase transitions below 8K. These transitions arise from the ordering of the quadrupole moments of the 5f2 electrons on the quasi-cubic uranium sites. UPd3 crystallises in the double hexagonal closed packed (dhcp) TiNi3 (D024) structure [1]. Thus, the uranium atoms occupy alternately sites of locally hexagonal and quasi-cubic symmetry, equivalent to a stacking of ABAC.
The first magnetisation measurements performed on polycrystalline UPd3 were conducted by Wernick et al. in 1965 at Bell Labs [2], and showed that the compound did not order magnetically. These and subsequent bulk property measurements, including resistivity [3] and electron spin resonance (ESR or EPR) of Gd in UPd3 [4,3], were initially interpreted using a band structure picture, and assumed that the uranium ions were itinerant. In order to explain the data, a very narrow 5f band was postulated. However, later measurements of the specific heat using single crystals by Andres et al. [5] in 1978, and triple-axis neutron spectroscopy by Buyers et al. [6] in 1980, showed that the uranium ion is in fact well localised, with a 5f2 configuration, corresponding to a valence of 4+. The phase transitions were also first observed by Andres et al. at 7K and 6K.
Further bulk measurements on the thermal expansion [7,8], magnetostriction [8], and elastic constants [9] refined the transition temperatures to T1 = 6.8K and T2 = 4.5K, and showed that both transitions are structural, but that the second also has a magnetic component. In addition, another transition above T1, at T0 » 7.8K was revealed in further heat capacity [10], magnetisation [11,12] and ultrasound [13] studies. Finally, the ultrasound studies also revealed that the T1 transition is actually two transitions, a second order transition at T+1 = 6.9K, and a first order transition at T-1=6.7K.
The structural nature of the transition at T1 was confirmed by polarised neutron diffraction (PND) by Steigenberger et al. in 1992 [14]. The authors observed superlattice reflections, at Q = ([1/2],0,3) and ([1/2],0,4), below T1 with a non-spin-flip cross-section when the neutron was polarised parallel to the scattering vector. The PND experiment also showed that the magnitude of the ordered magnetic moment was extremely small, » 10-2 mB/U-ion. Further PND experiments [15] in an applied magnetic field of » 4T, along with a group theoretical analysis [16], determined that the quadrupolar order parameter below T0 is Qx2-y2.
X-ray resonant scattering (XRS) studies by McMorrow et al. [17] observed the quadrupolar order directly for the first time in 2001. The XRS study appeared to agree with PND data below T0, with the Qx2-y2 structure giving a non-zero signal in the (p-p) channel for the (1,0,3) reflection as observed. Data below T1 showed that the (s-p) channel dominates in the (1,0,4) reflection which may be explained by a rotation of the charge densities. However, follow-up XRS experiments [18,19] using azimuthal scans showed conclusively that the order parameter below T0 is Qzx.
This result may be reconciled with the earlier data if the primary order parameter, Qzx, also induces a secondary order parameter Qx2-y2. Thus, in the PND experiments when a magnetic field is applied parallel to the real space a-direction, it will only induce antiferromagnetic moments aligned parallel to field for the Qx2-y2 case and not for the Qzx case [20].
In addition, inelastic neutron experiments conducted below T2 by McEwen et al. [21] revealed four excitations below 3meV. Two of these decrease in intensity until they disappear above T2, and above T1 only one mode remained, which eventually dies off above T0. A mean-field model involving antiferroquadrupolar (AFQ) ordering on the uranium cubic sites was proposed to explain these modes [12]. Previous x-ray scattering measurements indicated that the low temperature crystal structure has four inequivalent quasi-cubic sites based on the orthorhombic unit cell, forming four different sublattices. In the mean-field model, the two order parameters below T2, Qx2-y2 and Qzx combine in different combinations in each of the four sublattices, giving rise to different splittings of the quasi-cubic ground state doublet. Thus each sublattice gives rise to a different transition in the inelastic neutron spectra.
Finally, there have also been angle-resolved photoemission spectroscopy studies [22] and x-ray diffraction studies under high pressure [23]. There is thus a large body of experimental work on UPd3. However, there is still no satisfactorily comprehensive microscopic understanding of the phenomena observed. In part to rectify this we have completed some mean field calculations aimed at explaining both the bulk properties observed and the scattering data. This is described in section 3. First, though, a satisfactory crystal field scheme needed to be established, as the single ion crystal field interaction is much stronger than the inter-ion interactions (magnetic, quadrupolar, etc) which drives the ordering, and this is detailed in section 2. Finally, we also describe a magnetostriction experiment at high magnetic fields in order to probe the high field behaviour and to verify our model, in section 4.

2  Crystal Field Interactions

The Uranium ion in UPd3 is well localised with a valence of 4+ and a Hund's rule 3H4 spin-orbit ground state configuration. In addition, whilst the crystal field (CF) interaction in UPd3 is stronger than in rare earth intermetallics, it is still weaker than the spin-orbit interaction, so that we may still treat it as a perturbation which splits the spin-orbit ground state. The symmetry of the double hexagonal close packed (dhcp) structure means that there are two inequivalent sites, and hence two different CF splittings. The quasi-cubic site is split by a trigonal crystal field (quantised along the hexagonal c-axis, rather than along the tetragonal axis), resulting in six levels (three singlets and three doublets), whilst the hexagonal sites are split into another six levels (also three singlets and three doublets).
figs/UPd3_structure.png
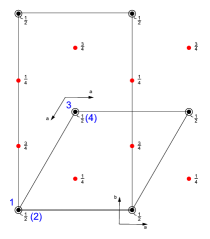
Figure 1: The TiNi3 structure. The fractions beside each atom indicates the z-coordinates. Uranium quasi-cubic sites are shown in black, hexagonal sites in grey. The Palladium ions neighbouring the quasi-cubic Uranium ions are shown in red, whilst those neighbouring the hexagonal sites in green. Also shown is the hexagonal unit cell, and the orthorhombic unit cell as used in reference [16] and subsequent papers.
Figure 1 shows the TiNi3 structure of UPd3, with the neighbouring Palladium ions around each hexagonal and quasi-cubic Uranium sites highlighted. Using these ionic positions, a point charge calculation was used to determine the signs of the applicable crystal field parameters given these symmetry. The results are summarised in table 2.
Quasi-cubic Hexagonal
B20 + B60 - B20 + B60 -
B40 - B63 + B40 - B66 -
B43 - B66 +
Figure 2: Point charge calculations crystal parameters. '+' and '-' indicates that the point charge calculations show that the crystal field parameters should be greater than or less than zero respectively.
However, these point charge calculations usually give a singlet ground state for both Uranium sites, as noted by Buyers et. al. [6], whereas we now believe that the quasi-cubic sites have a doublet ground state, as deduced from specific heat measurements at low temperatures [12]. Nevertheless, the point charge calculations can give a good indication of the sign of the crystal field parameters.
In addition, because we now know that the quadrupolar order parameter for the phase below T0 is Qzx from the XRS data, we also have a restriction on the wavefunction of this quasi-cubic doublet ground state. This follows from the mean-field Landau theory of phase transitions, because the eigenvalues of the Qzx operator are not the same if we change the operator from Qzx to -Qzx. Thus in the Landau free energy expansion in terms of the order parameter, we require terms up to third order, that is in Q3. There are thus two minima in the free energy as a function of the order parameter at constant temperature, and at the transition temperature the global minima (that is the equilibrium value of the order parameter) discontinuously change from one of the minima to the other (that is zero above the transition temperature, and finite below it), indicating a first order phase transition. However, all experimental observations so far indicate that the transition at T0 is second order, or at best, very weakly first order. Thus we need to restrict the matrix element of Qzx to ensure that its eigenvalues are the same for Q as for -Q, so that the free energy expansion needs to only include up to quadratic terms.
Expressing the Qzx operator in matrix form with the three lowest states of the quasi-cubic sites (see reference [12] for details), the doublets |d1ñ and |d2ñ and singlet |sñ, as basis states, we get:

^
Q
 

zx 
= æ
ç
ç
ç
è
0
A¢
A¢
A¢
0
B¢
A¢
B¢
0
ö
÷
÷
÷
ø
(1)
In order to ensure that the eigenvalues of [^Q]zx is the same as -[^Q]zx we need the matrix element B¢ = ád1| Qzx |d2ñ = ád2| Qzx |d1ñ to be approximately zero. The wavefunctions of the ground state doublet expressed in terms of the eigenstates of the J,Jz operators as:

|d1ñ
=
a|4ñ + b|1ñ + c|-2ñ
(2)
|d2ñ
=
a|-4ñ - b|-1ñ + c|2ñ
Thus the above requirement for the matrix element B¢ means that the product bc » 0.

2.1  Inelastic Neutron Data

Extensive triple-axis spectrometer (TAS) data were taken at the ILL by Alberto Martin-Martin and Keith McEwen [24] which revealed the dispersion of the CF modes in UPd3. In addition, we have also recently measured the inelastic excitations at 60K and 160K so as to thermally occupy the 15meV excited doublet on the hexagonal sites in order to determine the hexagonal site CF splitting. These measurements were made on a 50g powder sample on the HET spectrometer at the ISIS facility.
figs/amm_Ei23.png
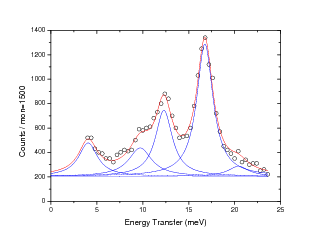
Figure 3: Inelastic neutron spectra from reference [24]. The solid lines show the fit to the data using five lorentzian peaks, with centres at: 4.05meV, 9.72meV, 12.3meV, 16.76meV, 20.41meV.
Figure 3 shows a scan from the ILL data at Q = (2.5, 0, 0) at 10K showing the crystal field excitations with fitted lorentzians. The data is well fitted by five lorentzian peaks, which apart from the large peak at 16.7meV are attributed to transitions from the quasi-cubic doublet ground state to its excited state. These energies will be used to fix the crystal field parameters on the quasi-cubic sites.
figs/het_10K_Ei50.png figs/het_multiT_Ei50.png
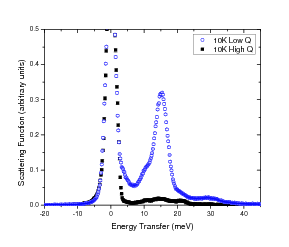
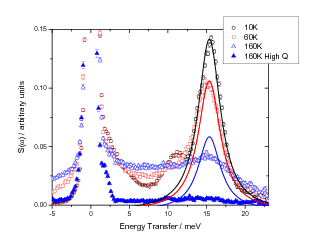
Figure 4: Inelastic neutron spectra from HET. The scans were taken with 50meV and 23meV incident energy. The left panel shows data from 10K, which shows the peaks previously seen in figure 3, and also an additional broad peak at approximately 30meV energy transfer. Solid lines on the right panel indicates a scaling of the 10K, 16meV peak by the Boltzmann factor to account for the thermal population of the hexagonal states, keeping background, peak position and width constant.
Figure 4 shows scans from the HET data at various temperatures. The large peak at 16meV energy transfer was first observed by Buyers et. al. [6] and attributed to the transition from the ground state |Jz = 0ñ singlet to an excited doublet with wavefunctions |Jz = 1ñ and |Jz = -1ñ. As the other states on the hexagonal sites do not have wavefunctions with |Jz = ±1ñ, there are no dipole matrix elements connecting them to the ground state, and they are thus not observed by neutron scattering, unless the temperature is sufficiently high that excited states are populated. The scaling of this 16meV peak with temperature indicates that there are no crystal field levels below » 5meV on the hexagonal sites, as these would have been populated had they exist, and would then reduce the spectral weight of the 16meV further. However the 160K peak shows that there may be other levels between » 5meV and » 15meV. Nonetheless the observed peak is close to the purely thermal prediction, indicating that any levels below 16meV would be at the higher energy end.

2.2  Crystal Field Parameter Fitting

Using the routines in reference [25], a matlab program was developed to calculate the crystal field (CF) parameters which would give a certain CF splitting. The program is reproduced in Appendix A, and relies on the orthogonality properties of tensor operators, tk(q), within a single J-multiplet which are composed of the Wigner 3j symbols:


å
M1,M2 
áJ,M1| tk(q) |J,M2ñ áJ,M2| tk¢(q¢) |J,M1ñ = 0 if k ¹ k¢, q ¹ q¢
(3)
The appendix also details the derivation of the relationship between the crystal field parameters and the energy and wavefunctions resulting from diagonalising a Hamiltonian with such parameters:

Bkq
=

å
n 

å
M1,M2 
En |Vnñ áVn| áJ,M1| Okq |J,M2ñ /
å
M1,M2 
áJ,M1| Okq |J,M2ñ áJ,M2| Okq |J,M1ñ
=

å
n 

å
M1,M2 
En |Vnñ áVn| áJ,M1| Okq |J,M2ñ / Tr æ
è
^
O
 
q
k 
é
ë
^
O
 
q
k 
ù
û
T
 
ö
ø
(4)
where the En and |Vnñ denotes the eigenvalues (energies) and eigenvectors (wavefunctions) of the crystal field Hamiltonian, |ñá| indicates an outer product, and [^O]kq the operator matrix.
Thus in fitting to the energy splitting, En, the algorithm used relies on finding a set of CF parameters, Bkq, from an initial set of wavefunctions, |Vnñ, using this new set of CF parameters to generate a new set of wavefunctions, and then iteratively feed this back until the energies (eigenvalues) generated are close to the desired values. However, this means the algorithm does not fit the wavefunctions, only the energy. Thus, it was used initially to fit to the energies observed using the neutron spectra shown above, and subsequently the parameters were altered by hand to produce the desired wavefunctions.
It was noted above that the symmetry of the order parameter below T0 required that the product of the coefficient of the doublet ground state wavefunction bc » 0. In addition, it was observed that the susceptibility in the x-direction increases below each quadrupolar phase transitions rather than decreasing as would be expected for magnetic ordering. On ordering, some of the first excited singlet state on the quasi-cubic site is mixed in with the doublet ground state, and this would enhance the van-Vleck susceptibility of the ordered state if the singlet state has a strong Jx coupling with higher excited states. The singlet states have wavefunctions:

|s1ñ
=
d|3ñ + e|0ñ - d|-3ñ
(5)
|s2ñ
=
d¢|3ñ + e¢|0ñ - d¢|-3ñ
(6)
|s3ñ
=
1

Ö2
( |3ñ - |-3ñ )
(7)
From fitting to the energy levels using the algorithm described, it was determined that the first excited singlet state at » 4meV had the form of |s1ñ with d » 0 and e » 1, whilst the excited doublet above it at » 10meV is of the form a¢|4ñ + b¢|1ñ + c¢|-2ñ but with b¢ » 1. Thus in order to ensure an increase in the x-direction susceptibility we need that the ground state doublet have a weak coupling Jx with the first excited state as well, which would be satisfied if we chose b » 0, for equations 2.
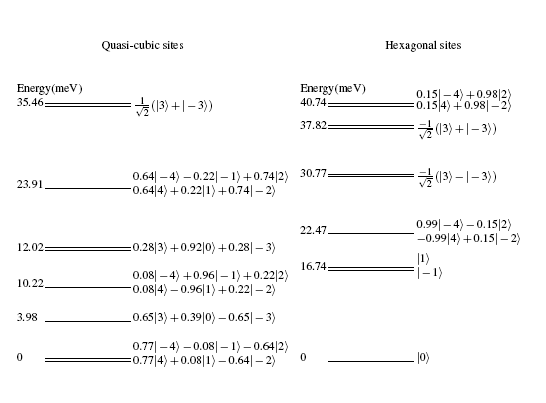
These requirements were met with the crystal field parameters in table 5. It should be noted that the values for B20 for both sites agree with magnetisation data taken on the D3 diffractometer at the ILL, where the crystal field anisotropy can be estimated from the susceptibility parallel to and perpendicular to the applied field. Finally, figure 6 shows the resulting crystal energy splitting and wavefunctions.
Quasi-cubic Hexagonal
B20 0.035 B60 -0.00012 B20 0.21 B60 0.00033
B40 -0.012 B63 0.0025 B40 -0.0117 B66 0.0014
B43 -0.00012 B66 0.0068
Jzxab 0.009 Jzxc -0.22 Jx2-y2ab -0.0012 Jx2-y2c 0.014
Figure 5: Parameters used. The upper panel shows the crystal field parameters in Stevens normalisation in meV. The lower panel shows the quadrupolar exchange parameters in meV.

Picture 1

Picture 2
Figure 6: Crystal Field Scheme. Left Panel: The crystal field energy levels and corresponding wavefunction expressed in the |J,Jzñ basis. Right Panel: The mixing of the excited states and ground state on the quasi-cubic site in the lowest temperature ordered phase as calculated in section 3.

3  Mean Field Calculations

We used the McPhase program [26] to calculate self consistently the mean field Hamiltonian:

H =
å
i 
é
ë
HCFi + HZ - 1

2

å
j 

å
a 
Jaij Qai Qaj ù
û
(8)
where i and j index the sites, and a index the quadrupolar operators Qzx and Qx2-y2. The crystal field Hamiltonians are:

HCFquasi-cubic
=

å
k=2,4,6 
Bk0 Ok0 +
å
k=4,6 
Bk3 Ok3 + B66 O66
HCFhexagonal
=

å
k=2,4,6 
Bk0 Ok0 + B66 O66
(9)
and the Zeeman Hamiltonian is:

HZ = - gJ mB Ji H
(10)
figs/UPd3_structure-Uonly.png
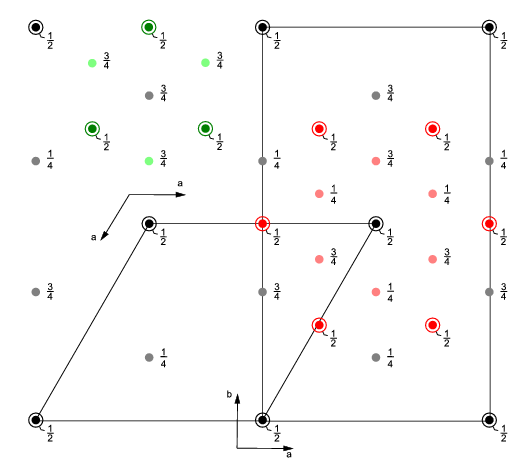
Figure 7: Uranium site positions. The hexagonal sites are in red, the quasi-cubic sites in black. The fractions indicate the z-coordinates, and whole numbers indicate the quasi-cubic site index.
In our mean field calculations we considered only two quadrupolar couplings: That within the basal plane between ions 1 and 3, and 2 and 4, and that along the c-axis between ions 1 and 2, and 3 and 4 (as shown in figure 7), which we shall denote Jab and Jc respectively. In addition, we only consider the coupling between Qzx and Qx2-y2 quadrupoles, hence we have four exchange parameters: Jzxab, Jzxc, Jx2-y2ab, Jx-y2c. Finally for the present we have ignored the RKKY exchange interactions, though a complete study must take these into account.
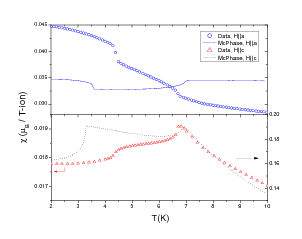
figs/mcphase_LT_susc.png figs/mcphase_LT_heat.png
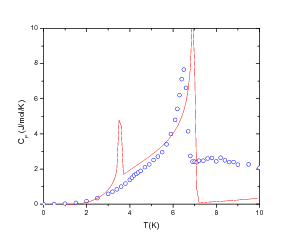
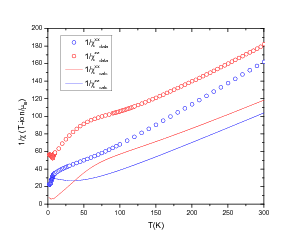
figs/mcphase_HT_susc.png figs/mcphase_HT_heat.png
Figure 8: Left panel: Low temperature susceptibility and high temperature inverse susceptibility. Right panel: Specific heat.
Previous inelastic neutron scattering data below the lowest phase transition, T2=4.4K, showed that there were four peaks at energy transfers of 1.28, 1.68, 2.20 and 2.60meV [21]. These peaks probably come from transitions between the ground state doublet on the quasi-cubic sites which have now been split by the quadrupolar ordering. That there were four peaks observed indicates that the quadrupolar exchange on different sites split the doublet by different amounts. We can simulate this behaviour using the four exchange parameters listed above, and after some considerations we found that the parameters listed in table 5 proved a fit to the experimental data. These parameters yielded transitions at 1.51, 1.93, 1.99 and 2.01meV in the lowest ordered phase, and two phase transitions at 3.5 and 7K. Unfortunately in order to increase the calculated transition energies to fit those observed the transition temperature is also raised beyond that which was observed. However, it must be noted that mean field calculations generally overestimate transition temperatures because they neglect the fluctuations.
The left panel on figure 8 shows the low temperature magnetic susceptibility. The McPhase simulations shows the same step up in the susceptibility with decreasing temperature at the lower transition in the x-direction as observed, but not at the higher temperature transition. In addition, in the z-direction, both calculated transitions show the same features as observed in the data, a step up then down with decreasing temperature. Unfortunately the magnitude of the calculated susceptibility does not match the data.
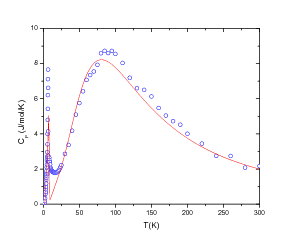
The right panel on figure 8 shows the magnetic contribution to the specific heat as calculated by McPhase and that which is observed by subtracting the specific heat of the non-magnetic isostructural compound ThPd3 from that measured on UPd3. The good fit at high temperatures, particularly the close match of the predicted peak in Cpmag with the data, indicate that the energy levels of the calculated crystal field split in good agreement with the data. The experimental determination of the magnetic specific heat also involves some non trivial errors because of the subtraction of the ThPd3 data from that of UPd3. At higher temperatures this yields a small value for the Cpmag with corresponding large errors, and in addition the measurement of the ThPd3 data was completed on a rather small sample, in which the addenda was a significant fraction of the total measured specific heat. Thus it is remarkable that we obtained such good agreement between data and model. At lower temperatures however, the mean field calculations yields two first order transitions rather than the single first order one that is observed.
Finally, whilst the ordered structure in the lower temperature calculated phase is in agreement with experimental observation (that is an antiferro-quadrupolar arrangement of Qzx and Qx2-y2 moments), the higher temperature phase structure is more ambiguous. The calculations with the exchange parameters shown yield a predominantly AFQ structure of Qx2-y2 moments which induced a small AFQ Qzx moment as a secondary order parameter. We believe that on the basis of using just exchange parameters of the type listed that it would be very hard to stabilise two phases, one with an AFQ arrangement of both Qzx and Qx2-y2, and another in which the Qzx moments are dominant, as is physically observed in the phase between T+1 and T0 in UPd3, because the Qzx moment is about two orders of magnitude weaker than the Qx2-y2 moment. However, the observations also indicate that Qx2-y2 is the dominant order parameter in the intermediate phases between T+1 and T2, and experiments have been planned to further resolve the order parameter in these phases.

4  High Field Magnetostriction

Whilst there are a wealth of data at zero applied magnetic fields of the various bulk and microscopic properties, the field dependence of UPd3 has only been measured up to 12T for the magnetisation [27], and 7T for magnetostriction [8]. Using inelastic neutron data [24] we were able to deduce a crystal field scheme [12] which is detailed in section 2. This scheme has a ground state doublet on the uranium sites with locally quasi-cubic symmetry, with an excited singlet 4meV above the ground state. An applied magnetic field would split the ground state doublet, and lower the singlet, so that at a certain critical field, a level crossing would occur, resulting in a phase transition. From the mean field calculations detailed in reference [12], this crossing was predicted to be with an applied field in the region of 30T.

4.1  Experimental Methods

There is thus a need both to explore the behaviour of UPd3 at higher fields than had been measured, and in particular in the region around 30T where a phase transition is expected. In November 2005, we were able to measure the magnetostriction of UPd3 up to 33T at the National High Magnetic Field Laboratory (NHMFL), Tallahessee, Florida. The measurements were made using capacitance dilatometers constructed by Rotter et al. [28] and mounted in a 4He cryostat in a 33T Bitter resistive magnet cell. Three dilatometers were used: the D-cell, constructed in Dresden by M. Doerr, the W-cell, constructed in Vienna, and the WP-cell, also constructed in Vienna by M. Rotter. The W- and D-cells have a diameter of 22mm whilst the WP-cell has a diameter of 20mm. In addition the WP-cell has a small resistive heater which is controlled by a Conductus LTC-20 temperature controller.
Each cell has its own Cernox resistance thermometer, denoted by RS (serial numbers X09555, X30533, X11005 respectively for the D-, W- and WP-cells), which is connected to the LTC-20. The cells were connected by dual-in-line pin and socket connection to a PCB mounted on a sample stick. On the PCB are mounted another Cernox thermometer, denoted Rc (serial number X31765) and a capacitance thermometer, denoted CT. These sensors and were connected by gold wires to a 37-pin DT12 connector into which a coaxial cable attached to a breakout box was plugged. The dilatometer was connected separately by gold wires to two BNC connectors which plug into an Andeen Hagerling AH2500A capacitance bridge. The Rc thermometer was connected to a Lake Shore LS340 temperature controller, and the CT thermometer to an Andeen Hagerling AH2700 capacitance bridge. Unfortunately early in the experiment the AH2700 bridge malfunctioned, and we were only able to replace it with another AH2500A, which subsequently caused interference with the bridge measuring the capacitance of the dilatometer because both bridges only operated at 1kHz. This meant that we were unable to use the CT thermometer.
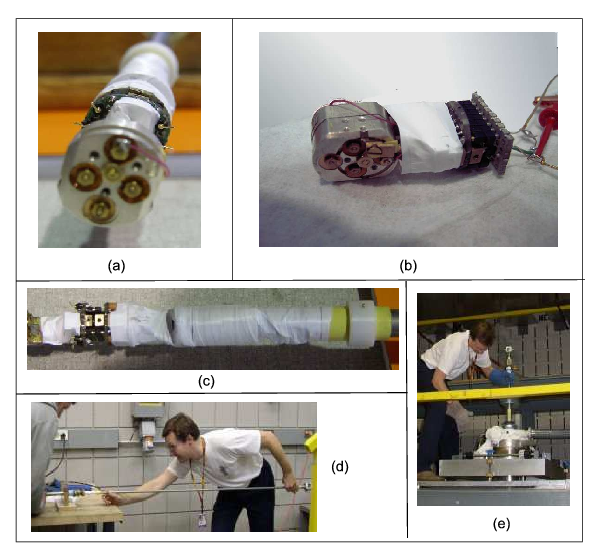
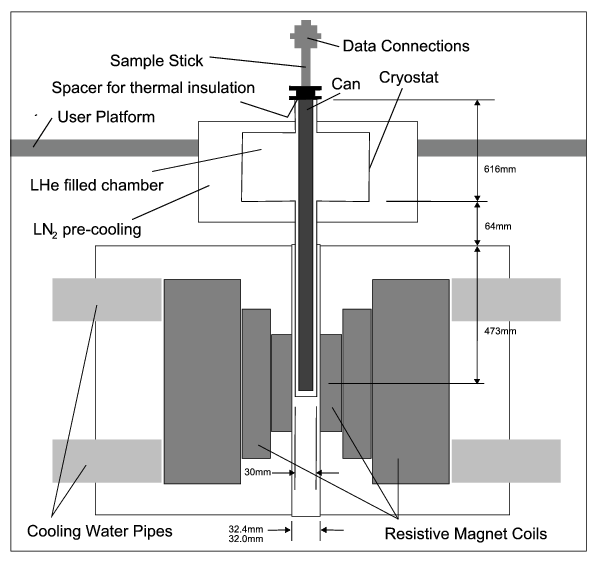
For measurements, the sample stick was placed inside a sealed can, of outer radius 30mm, which was then evacuated and filled with 4He exchange gas. Teflon tape was wrapped around the dilatometer and sample stick to insulate them, and keep stray wires tight against the stick body. In addition, yellow cryogenic tape was wrapped around the can to electrically isolate it. Care was take to thermally and electrically isolate the sample stick from the can which is in direct contact with the liquid 4He. However, because of the small dimensions involved this was not always possible. This allowed thermal contact between the sample and the cryogenic liquid which caused problems when we wanted to heat the sample to temperatures above 4.2K. The can and stick assembly was placed in the cryostat over a long period of time in order to reduce subsequent cooling time and loss of cryogenic liquid to vaporisation. Figure 9 shows photographs of the dilatometer, stick, can, and mounting in the cryostat. Figure 10 shows schematic diagrams of the magnet, cryostat and dilatometer assembly.
figs/fig1_photos.png
Figure 9: Photographs of the experimental set up. a) and b) the dilatometer. c) connection between the dilatometer and sample stick. d) inserting the sample stick into the can. e) mounting the can into the cryostat
figs/fig2_schem.png
Figure 10: Schematic drawing of experimental set up.
The bridge and temperature controllers were connected by an IEEE 488 bus to a PowerMac G5 computer running LabView with NHMFL-designed data taking software. The software automatically reads the field strength in the magnet from its controlling software with a mean error of the order of 0.1%. The AH2500A capacitance bridge is also extremely accurate with a nominal resolution of 5×10⁻⁷pF and accuracy of 1.5×10⁻⁷. However, electrical noise in the cables and connectors from the dilatometer to the bridge, and mechanical vibrations due to the resistive magnet cooling water system meant that the resolution was reduced by about two orders of magnitude with a corresponding loss in accuracy.
During measurements, we observed the expected magneto-resistance of the Cernox temperature sensors [29]. These introduced corrections into our temperature data, which proved negligible for the 4.2K measurements but was significant for high temperatures. In addition, we also observed a `bubble` effect where at high fields, the magneto-resistance, and hence inferred temperature, on ramping up and ramping down the field were not equal, and that at around 18T, there is a jump in the magneto-resistance on ramping down, after which the ramp up and ramp down curves were the same. This is occurs because 4He, the cryogen that we used, is diamagnetic, and hence experiences a force in the z direction proportional to B / z. It thus appears that at a critical field of around 18T, the field gradient is high enough to force the cryogen away from the (vertical) centre of the magnet, creating a bubble around the position of the dilatometer. Since there is no cryogen to cool the exchange gas directly around the dilatometer it begins to heat up. On ramping down past 18T, the cryogen suddenly rushes back in to fill the bubble and cools the dilatometer, accounting for the observed jump in magneto-resistance 1.

4.2  Experimental Results

Table 11 summarizes the data taken. Unfortunately we did not have time to measure fully all the transverse components, but we were able to measure all three longitudinal and three of the six transverse components of the magnetostriction tensor. Each component measure was also repeated once to ensure reproducibility. The raw capacitance data showed a large hysteresis between the ramp up and ramp down curves. However, this was mostly an artefact, due to eddy currents induced in the sample. This arises because the sample is not completely regular in shape, and in particular does not have parallel sides. So, when the field is switched from ramping up to down, a large turning moment is applied to the sample, which causes it to rotate within the dilatometer cell. The rotation is usually such that the gap between the plates is less, so a higher capacitance is measured as a result. The magnitude of the moment, and hence resulting capacitance change is related to the size of the eddy currents induced and hence the ramp rate. However, time constraints meant that we could not justify a rate lower than 2 Tesla per minute. Nonetheless we were able to eliminate this artefact by treating the ramp up and ramp down curves separately and then averaging between them.
Run # Field Length change Temperature Cell Notes
direction direction (K) Name
5 c c 4.2 RW
6 c c 4.2 RW
7 a a 4.2 RD
8 a a 4.2 RD
9 b b 4.2 RWP
10 b b 4.2 RWP Field ramped at 3T/min
11 b b 7.5 RWP
12 b b 6 RWP
13 a c 4.2 RW
14 a c 4.2 RW
17 a b 4.2 RWP
18 a b 4.2 RWP
19 b a 4.2 RW
20 b a 4.2 RW Interference between cap. bridges
22 b a 4.2 RW
Figure 11: Run list of data taken on UPd3. The applied magnetic field was ramped at 2T/min except where indicated.
After the data measurements a calibration measurement was completed by manually adjusting the dilatometer using a micrometer screw and measuring the capacitance. This calibration was repeated for each cell and was used in the program GCALC, written by M. Rotter, to convert the measured capacitance to a gap size in nm, using the equations outlined in reference [28]. GCALC also took into account the thermal expansion of the dilatometer, made out of silver, using data from the literature [30] and assuming a temperature of 4.2K throughout.
Before the conversion, the measured capacitance was put into bins of size 0.5T, and the data was separated into ramp up and ramp down field components. The binning was to reduce the noise in the data due to mechanical vibrations, mostly from the cooling water for the resistive magnets. The conversion using GCALC was applied to the ramp up and down separately, and the magnetostriction, Dl / l was calculated for the ramp up and down. These curves showed some hysteresis at low fields, with the largest effects in the longitudinal c-direction (H||c, Dl||c), in agreement with data in the literature [8]. There is some difference between the ramp up and ramp down curves at high fields as well, but this was generally small, and may be partly due to thermal expansion due to the 'bubble' effect described above. Thus, we combined the ramp up and ramp down data into one curve, and average the two runs for each magnetostrictive components.
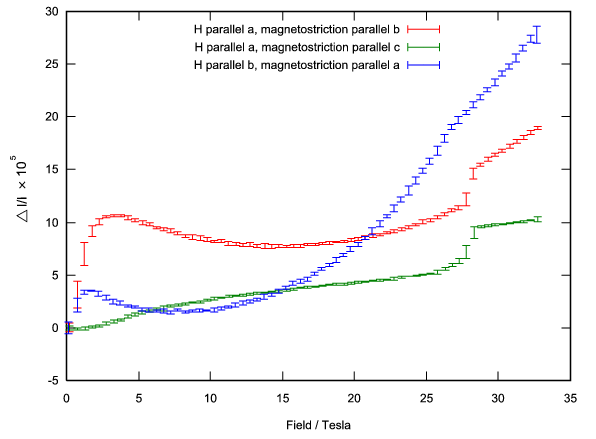
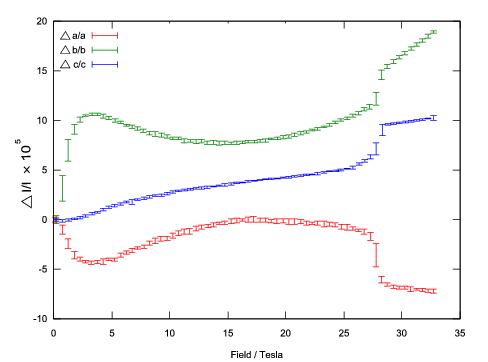
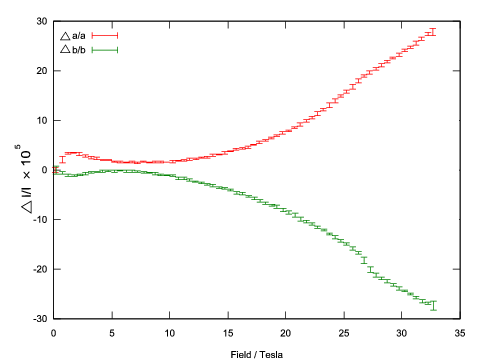
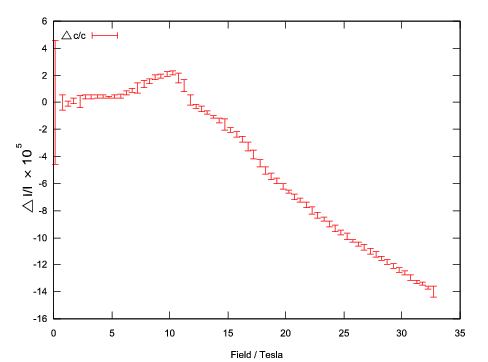
The data is shown in Figures 12 and 13, showing the longitudinal and transverse components respectively. From the data, it may be seen that there is a phase transition at 27.8 ±0.5 T when the field is applied in the a-direction, whilst it is at 26.7 ±0.5 T when the field is in the b-direction. There were no phase transitions observed with the magnetic field applied parallel to the c-direction.
figs/fig3_upd3_ms_long.png
Figure 12: Longitudinal Magnetostriction of UPd3 at 4.2K. The data has been put into 0.5T bins, and ramp up and down, and repeated measurements averaged. High field transitions are seen at 27.8±0.5T in the a-direction and 26.7±0.5T in the b-direction.
figs/fig4_upd3_ms_trans.png
Figure 13: Transverse Magnetostriction of UPd3 at 4.2K. The data has been put into 0.5T bins, and ramp up and down, and repeated measurements averaged. High field transitions are seen at 27.8±0.5T with the field in the a-direction and 26.7±0.5T in the b-direction.
Unfortunately the magneto-resistive dependence of our temperature resistor, Rc combined with the 'bubble' effect described above, meant that the heater control at temperatures higher than base temperature was not constant with field. We observed that the heater power was markedly higher on ramping up than ramping down at the same fields. Thus we were unable to maintain a constant temperature for the (nominal) 6K and 7.5K scans. Instead we observed large differences between the ramp up and ramp down curves, which is most likely to be due to thermal expansion due to the increased heater power on the ramp up. In addition, whereas the magnetostriction at 4K in the longitudinal b-direction showed that the crystal becomes increasingly compressed at high fields, the data at 6K and 7.5K appear to show the crystal expanding. However this is mostly like to be due to thermal expansion. This is supported by the data at low (0-10T) fields which follow closely the 4K data. It is also interesting to note that we did not observe any high field transitions in the 7.5K data, but there is a suggestion of a transition in the 6K data. However, this is not conclusive due to the thermometry problems noted above.

4.3  Meanfield Calculations

Using the same quadrupolar exchange parameters as in section 3, we were able to calculate the thermal expectation values for the spin and quadrupolar correlation functions, from which the magnetostriction data may be fitted using:

eaa
=
eaaCF + eaaEX
(11)
eaaCF
=
1

N

å
i 
[ Aa áO20 ñT,H + Ba áO22 ñT,H ]
(12)
eaaEX
=
1

N

å
i 
[ Ka,zx áQzx,i Qzx,i ñT,H
+ Ka,x2-y2 áQx2-y2,i Qx2-y2,i ñT,H ]
(13)
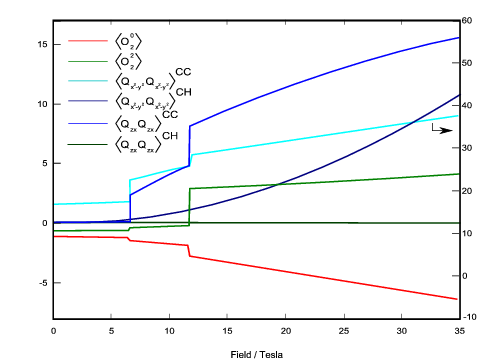
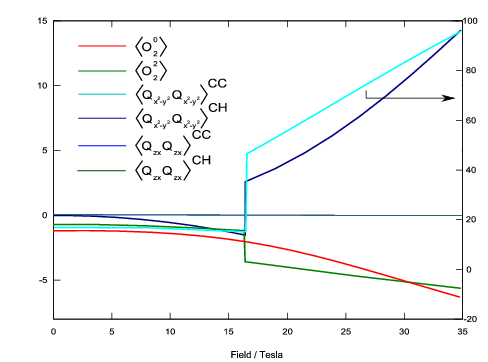
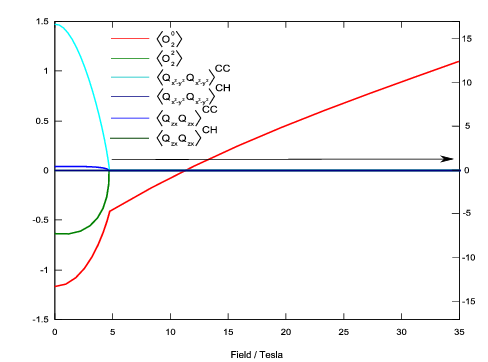
where i index the U4+ sites, a index the strain directions, and áñT,H indicates the thermal expectation values, which are calculated by McPhase. The CF and EX label the crystal field and exchange contributions respectively. Unfortunately the exchange parameters that we used yielded transitions at much lower fields than observed in the magnetostriction data. In the a-direction the calculations yield two transitions at 6.5T and 11.5T, whilst in the b-direction, one transition at 16.5T, and in the c-direction, at 4.8T. Thus we were unable to obtain any fits to the experimental data with the current set of exchange parameters. The lower panels on figure 14 shows the calculated thermal expectation values áO20 ñ, áO22 ñ, áQzx Qzx ñ, áQx2-y2 Qx2-y2 ñ.
figs/data_ms_xHa.png figs/data_ms_xHb.png figs/data_ms_xHc.png
figs/mcphase_ms_xHa.png figs/mcphase_ms_xHb.png figs/mcphase_ms_xHc.png
Figure 14: Magnetostriction data (top) and correlation function calculations (bottom). The panels show from left to right: With field in the a-, b-, and c-directions. The CC and CH in the lower panels indicate cubic-cubic and cubic-hexagonal site coupling respectively.

5  Conclusions

We have presented an analysis of the low temperature behaviour of UPd3, and have deduced a set of crystal field and mean field quadrupolar exchange parameters which model some features of the observed behaviour. In addition, we have completed magnetostriction measurements at 4K, in the lowest temperature order phase, up to 33T. The analysis is still far from complete, and in particular the crystal field parameters may still be needed to be modified as it does not quite fit the higher energy inelastic neutron scattering data. The mean field model, calculated with McPhase however shows much promise and further work to refine it and to include other quadrupolar exchange interactions beyond nearest neighbour, and as to include magnetic dipolar exchange interactions is in progress. Within this effort, we will as attempt to model the magnetostriction using quadrupole-quadrupole correlation functions as described in reference [31].

References

[1]
T. J. Heal, G. I. Williams, Acta. Cryst. 8 (1955) 494-498.
[2]
J. H. Wernick, H. J. Williams, D. Shaltiel, R. C. Sherwood, J. Appl. Phys. 36 (1965) 982-983.
[3]
M. T. Beal-Monod, D. Davidov, R. Orbach, Phys. Rev. B 14 (1976) 1189.
[4]
D. Davidov, H. Lotem, D. Shaltiel, M. Weger, J. H. Wernick, Phys. Rev. 184 (1969) 481.
[5]
K. Andres, D. Davidov, P. Dernier, F. Hsu, W. A. Reed, Sol. State. Comm. 28 (1978) 405-408.
[6]
W. J. L. Buyers, A. F. Murray, T. M. Holden, E. C. Svensson, P. de V. DuPlessis, G. H. Lander, O. Vogt, Physica B+C 102 (1980) 291-298.
[7]
H. R. Ott, K. Andres, P. H. Schmitt, Physica B+C 102 (1980) 148.
[8]
S. W. Zochowski, K. A. McEwen, Physica B 199&200 (1994) 416-418.
[9]
M. Yoshiwara, B. Lüthi, T. Goto, T. Suzuki, B. Renker, A. de Visser, P. Frings, J. J. M. Franse, J. Mag. Mag. Mater. 52 (1985) 413.
[10]
S. W. Zochowski, M. de Podesta, C. Lester, K. A. McEwen, Physica B 206&207 (1995) 489-491.
[11]
J.-G. Park, K. A. McEwen, Unpublished data.
[12]
K. A. McEwen, J.-G. Park, A. J. Gipson, G. A. Gehring, J. Phys: Cond. Mat. 15 (2003) S1923-S1935.
[13]
N. Lingg, D. Maurer, V. Müller, K. A. McEwen, Phys. Rev. B 60 (1999) R8430-R8433.
[14]
U. Steigenberger, K. A. McEwen, J. L. Martinez, D. Fort, J. Mag. Mag. Mater. 108 (1992) 163-164.
[15]
K. A. McEwen, U. Steigenberger, K. N. Clausen, J. Kulda, J. G. Park, M. B. Walker, J. Mag. Mag. Mat. 177-181 (1998) 37-40.
[16]
M. B. Walker, C. Kappler, K. A. McEwen, U. Steigenberger, K. N. Clausen, J. Phys: Cond. Mat 6 (1994) 7365-7371.
[17]
D. F. McMorrow, K. A. McEwen, U. Steigenberger, H. M. Rønnow, F. Yakhou, Phys. Rev. B 87 (2001) 057201.
[18]
K. A. McEwen, H. C. Walker, P. Boulet, E. Colineau, F. Wastin, S. B. Wilkins, D. Fort, J. Phys. Soc. Japan 75 Suppl. (2006) 20-23.
[19]
H. C. Walker, K. A. McEwen, D. F. McMorrow, S. B. Wilkins, F. Wastin, E. Colineau, D. Fort, Phys. Rev. Lett. 97 (2006) 137203.
[20]
K. A. McEwen, H. C. Walker, M. D. Le, D. F. McMorrow, E. Colineau, F. Wastin, S. B. Wilkins, J.-G. Park, R. I. Bewley, D. Fort, J. Mag. Mag. Mat. To be published.
[21]
K. A. McEwen, U. Steigenberger, J. L. Martinez, Physica B 186-188 (1993) 670-674.
[22]
T. Ito, H. Kumigashira, S. Souma, T. Takahashi, Y. Haga, Y. Tokiwa, Y. Onuki, Phys. Rev. B 66 (2002) 245110.
[23]
S. Heathman, M. Indiri, J. Rebizant, P. Boulet, P. S. Normile, L. Havela, V. Sechovský, T. le Bihan 67 (2003) 180101.
[24]
A. Martin-Martin, Magnetism in uranium intermetallic compounds, Ph.D. thesis, University College London (2000).
[25]
D. Newman, B. K. C. Ng, Crystal Field Handbook, 1st Edition, Cambridge University Press, 2000.
[26]
M. Rotter, J. Magn. Mag. Mat. 272-276 (2004) 481-482.
[27]
K. A. McEwen, M. Ellerby, M. de Podesta, J. Mag. Mag. Mat. 140-144 (1995) 1411-1412.
[28]
M. Rotter, H. Müller, E. Gratz, M. Doerr, M. Loewenhaupt, Rev. Sci. Instr. 69 (1998) 2742-2746.
[29]
B. L. Brandt, D. W. Liu, L. G. Rubin, Rev. Sci. Instr. 70 (1999) 104-110.
[30]
Y. S. Touloukian, R. K. Kirby, R. E. Taylor, P. D. Desai, Thermal expansion - metallic elements and alloys, in: Thermophysical Properties of Matter, vol. 12, Plenum Publishing Corporation, New York, 1975.
[31]
M. Rotter, M. Doerr, M. Loewenhaupt, P. Svoboda, J. App. Phys. 91 (10).
[32]
K. W. H. Stevens, Proc. Phys. Soc. A 65 (1952) 209-215.
[33]
M. T. Hutchings, Solid State Physics, Vol. 16, Academic Press, New York, 1964, pp. 227-273.
[34]
H. A. Buckmaster, R. Chatterjee, Y. H. Shing, phys. stat. sol. (a) 13 (1972) 9-50.
[35]
C. Rudowicz, J. Phys. C: Solid State Phys. 18 (1985) 1415-1430.
[36]
D. Smith, J. H. M. Thornley, Proc. Phys. Soc. 89 (1966) 779-781.

A  fitengy.m

We start with an expression for the single-ion crystal field Hamiltonian, constructed from summing over the Stevens operators appropriate to the point symmetry of the magnetic ion under consideration:

HCF =
å
k 
k
å
q=-k 
Bkq Okq
(14)
where the sum is only over terms of rank k=2,4,6, for ions with unfilled outer f-electron shells. Bkq denotes the crystal field parameters and Okq denotes the Stevens operators. These operators were exhaustively listed by Stevens himself [32] and others [33]. However, for computational reasons, we have chosen to calculate the operator equivalent to spherical harmonics due to Buckmaster et al. [34,35], rather than the Stevens operators themselves, which are tensor operators equivalent to tesseral harmonics. This choice facilitates easier computation, but in order to ensure that the crystal field parameters obtained have the same normalisation as those for the Stevens operators, we then re-express the Buckmaster operators as Stevens operators:

Okq
=
akq [ Tk-q + (-1)q Tkq ]
1cmq > 0
Ok0
=
ak0 Tk0
1cm
Okq
=
i akq [ Tk-|q| + (-1)q Tk+|q| ]
1cmq < 0
(15)
These Tkq operators in turn are constructed in matrix form with matrix elements:

áJ,M1| Tkq |J,M2ñ =
å
k,q 
(-1)J-M1 æ
ç
ç
è
J
k
J
-M1
q
M2
ö
÷
÷
ø
áJ || Tk || J ñ
(16)
where the middle brackets indicate the 3j symbol and the last term indicates the reduced matrix elements, whose expression depends on the normalisation chosen for the crystal field parameters. We have chosen to use the standard Stevens normalisation, so that the reduced matrix element is given by [36]:

áJ| | Tk | |Jñ = 1

2k
  æ
Ö

(2J + k + 1)!

(2J-k)!
 
(17)
and the coefficients akq are tabulated in Rudowicz [35]
The orthogonality relation for the 3j symbols are given by:


å
M,M¢ 
æ
ç
ç
è
J
k
J
M
q
M¢
ö
÷
÷
ø
æ
ç
ç
è
J
k¢
J
M¢
q¢
M
ö
÷
÷
ø
= 1

2k + 1
dkk¢ dqq¢
(18)
We see thus that the Stevens operators have the orthogonality properties shown in equation 3. Now, the matrix elements of the crystal field Hamiltonian can be expressed as:

áJ,M1| HCF |J,M2ñ =
å
k,q 
Bkq áJ,M1| Okq |J,M2ñ
(19)
so it follows that if we right multiply by áJ,M2| Ok¢q¢ |J,M1ñ and sum equation 19 over all M1,M2 we get:


å
M1,M2 
æ
è

å
k,q 
Bkq áJ,M1| Okq |J,M2ñ ö
ø
áJ,M2| Ok¢q¢ |J,M1ñ = Bk¢q¢
å
M1,M2 
áJ,M1| Ok¢q¢ |J,M2ñ áJ,M2| Ok¢q¢ |J,M1ñ
(20)
from the orthogonality relation 18. Finally, substituting back in equation 14 (and dropping the primes):

Bkq =
å
M1,M2 
áJ,M1| HCF |J,M2ñ áJ,M2| Okq |J,M1ñ /
å
M1,M2 
áJ,M1| Okq |J,M2ñ áJ,M2| Okq |J,M1ñ
(21)
If we express the eigenvalues (energies) and eigenvectors (wavefunctions) of HCF as En and |Vnñ respectively, then in terms of the eigenstates of the J,Jz operators, |J,Mñ, we get:

|Vnñ =

å
M 
cn,M |J,Mñ
(22)
En =
áVn| HCF |Vnñ
=
å
M1,M2 
cn,M1 áJ,M1| HCF |J,M2ñ  cn,M2
(23)
Now, if we form a matrix V with its column being the eigenvectors Vn, and another matrix E composed of the eigenvalues En along its diagonal, we can re-express the crystal field Hamiltonian matrix in terms of E and V as Hcf = VEV-1. However, because Hcf is hermitian, V-1 = VT. Explicitly this eigenvalue decomposition equation is:

HCF =
å
n 
|Vnñ áVn| En
(24)
We can thus substitute the expression for HCF in equation 21 to get an expression for the parameters Bkq in terms of the energy and wavefunctions. Finally, we note that the operator HCF must be Hermitian as it corresponds to a physical observable, so that its matrix element obey:

áJ,M1| HCF |J,M2ñ = áJ,M2| HCF |J,M1ñ
(25)
So that the steps leading from equation 19 to equation 21 may be repeated using the right hand side term in equation 25 instead yielding equation 4 quoted in section 2.2
Finally we include the implementation of the above algorithm in Matlab, based on the routine in reference [25].
function [FitB2,FitB4,FitB6] = fitengy(A,B2,B4,B6,E,ind_par,constraints)
% fitengy(A,B2,B4,B6) - attempts to fit crystal field parameters in meV.
%
% Syntax:  [FitB2,FitB4,FitB6] = fitengy(A,B2,B4,B6,E,ind_par,constraints) 
%
% Inputs:  A  = [L S J] with L,S,J being the angular momentum quantum 
%                numbers of the ground state multiplet; 
%                 -2  -1  0   1   2
%          B2 = [B   B   B   B   B  ] 
%                 2   2   2   2   2     are guesses for the crystal field
%          B4 = [B_4^{-4} ... B_4^4]    parameters in Stevens normalisation.
%          B6 = [B_6^{-6} ... B_6^6]    in meV.
%          E  = [E_1 E_2 .. E_2J+1]  is a (2J+1)-component vector with the 
%                known crystal field energies levels in meV
%          ind_par = [index_1 ...] 
%                is a matrix with the index of the parameters to be fitted.
%                If ind_par = 0; or not given all non-zero parameters will 
%                be fitted
%          constraints = [15 x 15] matrix of constraints on the CF params.
%                The params are indexed as [B20 B21 B22 B40...B44 B60...B66]
%                The rows in the constraints matrix indicate the dependent
%                parameter and the columns the independent parameter. E.g.
%                to specify that B44 = 5*B40, where B44 is the 8th element
%                of the parameter vector, and B40 is the 4th, then the 
%                element constraints(8,4) = 5; To specify B64 = 21*B60, 
%                the element constraints(13,9) = 21; All other elements is
%                zero.
% 
% Outputs: FitB2, FitB4, FitB6 are best estimates of the crystal field 
%          parameters for the given energy levels.
%
% Please note that this function will only attempt to fit the non-zero
% parameters given in B2,B4,B6. If you want a zero initial value for a
% parameter please set it to eps.
%
% This routine is based on the program ENGYFIT.BAS included in the book
% The Crystal Field Handbook by Newman and Ng, CUP 2000.

% By Duc Le (2005) - duc.le@ucl.ac.uk

% The crystal field parameter is given by:
%
%          ---             q            ---             q
%          >        E  <l|O |m>         >        E  <l|O |m>
%   q      ---l,m    m     k            ---l,m    m     k
%  B  = ________________________ =  ____________________________
%   k   ---        q        q                q         q    T
%       >      <l|O |m> <m|O |l>     Tr( <l|O |m> [<m|O |l>]  )
%       ---l,m     k        k                k         k

% To make the equations look nicer
L = A(1); S = A(2); J = A(3);

% The matrix elements of the Stevens operator given by:
%                                                         ____________
%          k                 J-M_j                     -k | (2J+k+1)!
% <LSJM | O  |L'SJ'M'> = (-1)      ( J  k  J' )   *   2   | ---------
%      j   q        j              (-Mj q  Mj')          \|  (2J-k)!
%
%   where this is the 3-j symbol---^  and reduced matrix element--^
%
% Reference: D.Smith and J.H.M. Thornley, Proc. Phys. Soc., 1966, vol 89, pp779.

% Works out the reduced matrix elements
if 2*J-2>0
  RM2 = (1/4) * sqrt( factorial(2*J+2+1) / factorial(2*J-2) );
else 
  RM2 = 0;
end
if 2*J-4>0
  RM4 = (1/16) * sqrt( factorial(2*J+4+1) / factorial(2*J-4) );
else
  RM4 = 0;
end
if 2*J-6>0
  RM6 = (1/64) * sqrt( factorial(2*J+6+1) / factorial(2*J-6) );
else
  RM6 = 0;
end

% Works out the matrix elements <i|O_k^q|j> 
ind_i = 0;
for Mj = -J:J
  ind_i = ind_i + 1;
  ind_j = 0;
  for Mjp = -J:J
    ind_j = ind_j + 1;
% Rank 2 
    O_mat_el(ind_i,ind_j,1) = (-1)^(J-Mj) * threej([J 2 J; -Mj 0 Mjp]) * RM2 * 2;    
    O_mat_el(ind_i,ind_j,2) = (-1)^(J-Mj) * threej([J 2 J; -Mj 1 Mjp]) * RM2 *-sqrt(6);
    O_mat_el(ind_i,ind_j,3) = (-1)^(J-Mj) * threej([J 2 J; -Mj 2 Mjp]) * RM2 * 2/sqrt(6);

% Rank 4
    O_mat_el(ind_i,ind_j,4) = (-1)^(J-Mj) * threej([J 4 J; -Mj 0 Mjp]) * RM4 * 8; 
    O_mat_el(ind_i,ind_j,5) = (-1)^(J-Mj) * threej([J 4 J; -Mj 1 Mjp]) * RM4 *-2/sqrt(5);
    O_mat_el(ind_i,ind_j,6) = (-1)^(J-Mj) * threej([J 4 J; -Mj 2 Mjp]) * RM4 * 4/sqrt(10);
    O_mat_el(ind_i,ind_j,7) = (-1)^(J-Mj) * threej([J 4 J; -Mj 3 Mjp]) * RM4 *-2/sqrt(35);
    O_mat_el(ind_i,ind_j,8) = (-1)^(J-Mj) * threej([J 4 J; -Mj 4 Mjp]) * RM4 * 8/sqrt(70);

% Rank 6
    O_mat_el(ind_i,ind_j,9) = (-1)^(J-Mj) * threej([J 6 J; -Mj 0 Mjp]) * RM6 * 16;
    O_mat_el(ind_i,ind_j,10) = (-1)^(J-Mj) * threej([J 6 J; -Mj 1 Mjp]) * RM6 *-8/sqrt(42);
    O_mat_el(ind_i,ind_j,11) = (-1)^(J-Mj) * threej([J 6 J; -Mj 2 Mjp]) * RM6 * 16/sqrt(105);
    O_mat_el(ind_i,ind_j,12) = (-1)^(J-Mj) * threej([J 6 J; -Mj 3 Mjp]) * RM6 *-8/sqrt(105);
    O_mat_el(ind_i,ind_j,13) = (-1)^(J-Mj) * threej([J 6 J; -Mj 4 Mjp]) * RM6 * 16/3/sqrt(14);
    O_mat_el(ind_i,ind_j,14) = (-1)^(J-Mj) * threej([J 6 J; -Mj 5 Mjp]) * RM6 *-8/3/sqrt(77);
    O_mat_el(ind_i,ind_j,15) = (-1)^(J-Mj) * threej([J 6 J; -Mj 6 Mjp]) * RM6 * 16/sqrt(231);
  end
end

% Arranges energies in ascending order and sets ground state to zero.
E = sort(E) - mean(E); 

% Initialises values
FitB2 = B2; FitB4 = B4; FitB6 = B6;
FitB = [B2([3 4 5]) B4([5 6 7 8 9]) B6([7 8 9 10 11 12 13])];
leastsqfit = 0;

% NB: B20 = FitB(1)
%     B40 = FitB(4)  B43 = FitB(7)
%     B60 = FitB(9)  B63 = FitB(12)  B66 = FitB(15)

% Indexes non-zero parameters to fit
if nargin > 5 
  ind_par_flag = sum(ind_par);
  if ~ind_par_flag
    ind_par = [(find(B2)-2) (find(B4)-4+3) (find(B6)-6+8)];
  end
else
  ind_par = [(find(B2)-2) (find(B4)-4+3) (find(B6)-6+8)];
end

% Starts iterations
for num_iteration = 1:100
  
  Hcf = xtalfld_hmltn_stev(A,FitB2,FitB4,FitB6);
  [V, Ecalc] = eig(Hcf);
  Ecalc = Ecalc(logical(eye(2*J+1)));

  if abs( leastsqfit - sum((Ecalc - E').^2) ) < 1e-7 
    break
  end
  leastsqfit = sum((Ecalc - E').^2)
  Ei = (Ecalc - min(Ecalc))'

  for ind_B = ind_par
    numer = 0;

% The numerator = sum_i,j( Ei <j|O_k^q|i> )
    for ind_i = 1:(2*J+1)
      for ind_j = 1:(2*J+1)
        for ind_k = 1:(2*J+1)
          numer = numer + V(ind_j, ind_i) * O_mat_el(ind_j,ind_k,ind_B) * V(ind_k,ind_i) * E(ind_i);
        end
      end
    end

% The denominator = Tr(<i|O_k^q|j><j|O_k^q|i>)
    denom = trace( O_mat_el(:,:,ind_B)' * O_mat_el(:,:,ind_B) );

    FitB(ind_B) = numer / denom; 
  end

% Updates constraints
  if nargin > 6
    cstr = constraints * FitB';
    cstr_ind = find(cstr); 
    FitB(cstr_ind) = cstr(cstr_ind);
  end

  FitB2 = [0 0 FitB([1 2 3])];
  FitB4 = [0 0 0 0 FitB([4 5 6 7 8])];
  FitB6 = [0 0 0 0 0 0 FitB([9 10 11 12 13 14 15])];

end

Footnotes:

1Explanation due to James Brookes (FSU)


File translated from TEX by TTH, version 3.77.
On 18 Jan 2007, 13:44.

Return to Work Index